Position Business Performance Analytics correctly
BPA provides prebuilt analytical experiences for Finance and Operations data: Microsoft reports, Power BI authoring, Excel authoring and an extensible dimensional model. See What is Business performance analytics?
The project is not complete when the app is installed. Teams must agree definitions, legal-entity scope, calendars, access rights and reconciliation controls before opening dashboards to business users.
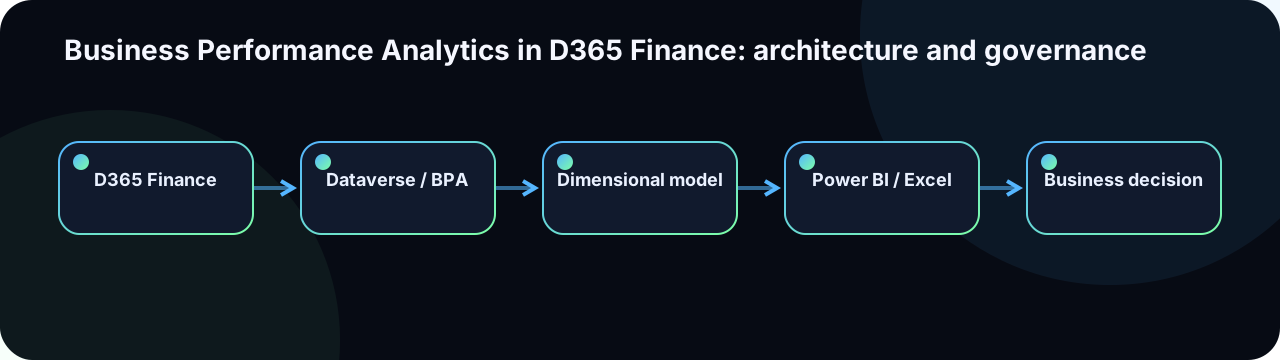
Logical architecture
| Layer | Responsibility | Key concern |
|---|---|---|
| D365 Finance | Transactions, master data and business rules | Dimension, date and posting status quality |
| Dataverse / BPA integration | Application orchestration and exposure | Power Platform environment, capacity and administration account |
| BPA dimensional model | Facts, dimensions and analytical relationships | Grain, keys and slowly changing dimension history |
| Power BI / Excel | Visualisation and exploration | Semantic layer security, measures and performance |
| Microsoft Fabric | External-data extension and advanced analytics | Preserve star schema; govern shortcuts and Lakehouse |
Prepare the installation
- Validate D365 Finance version and environment type in Before installing Business performance analytics.
- Use a customer-owned, non-personal service administration account (not a named user's identity).
- Review the linked Power Platform environment: region alignment with Finance, capacity and licensing.
- Map D365, Dataverse and BPA security roles to the organisational responsibility model.
- Plan data reconciliation tests — agree tolerances and accountable owners — before user enablement.
Installation is performed from the Power Platform admin centre as a Dynamics 365 app; see Install Business performance analytics.
Design a defensible KPI
name: Gross margin rate
owner: Finance Controlling — responsible for definition and reconciliation
formula: (Revenue - CostOfGoodsSold) / Revenue
currency: Company accounting currency (EUR)
grain: Posted customer invoices and credit notes, per legal entity per month
scope_inclusions:
  - All posted customer invoices in scope legal entities
scope_exclusions:
  - Intercompany eliminations not yet posted as of refresh
  - Statistical transaction lines
refresh_expectation: Twice daily (06:00 and 18:00 UTC)
reconciliation:
  source: General ledger trial balance — Account 70xxxx (Revenue) and 60xxxx (COGS)
  tolerance: 0.1 percent per period per legal entity
  frequency: Monthly at period close
escalation_if_discrepancy: Finance controlling → IT Data team
Every KPI needs a definition, grain, owner, refresh expectation and reconciliation method. Otherwise dashboard reviews become debates about the number rather than decisions based on it. Store the data dictionary in a versioned document linked from the Azure DevOps wiki.
Preserve the dimensional model
A healthy extension adds facts and dimensions with explicit keys and relationships rather than exposing a collection of operational tables. Microsoft emphasises preserving a star schema in Extend Business performance analytics in Microsoft Fabric.
- Define fact grain before measures. A revenue fact at invoice line grain cannot reliably aggregate to customer or product without a matching dimension.
- Avoid uncontrolled many-to-many relationships in the semantic layer.
- Use conformed dimensions (Date, Legal Entity, Customer) across multiple fact tables.
- Document slowly changing dimensions (customer segment history, cost centre hierarchy changes) explicitly.
- Do not recreate complex accounting logic in Power BI DAX when D365 already owns the authoritative calculation (e.g., currency revaluation, accruals).
Microsoft Fabric integration
Fabric connects to BPA through a Dataverse direct integration and OneLake shortcuts, reusing the BPA dimensional model without data duplication. The pattern:
Dataverse (BPA tables)
  └── OneLake shortcut → Fabric Lakehouse
        ├── BPA facts and dimensions (read-only via shortcut)
        ├── External data sources (HR, CRM, budgets)
        └── Unified analytical layer (notebooks, pipelines)
└── Power BI semantic model (DirectLake)- Shortcuts are read-only against Dataverse. Do not write back to BPA tables from Fabric.
- External tables added in Fabric must respect the same grain and key conventions as BPA tables to enable reliable joins.
- Apply Fabric workspace and item permissions consistent with BPA role assignments. Legal-entity row-level security must be tested end-to-end, including DirectLake queries.
- Monitor Fabric capacity consumption after each data refresh to detect runaway queries or oversized models.
Security and sharing
Access spans five layers: D365 Finance visibility, BPA/Dataverse application roles, Power BI semantic model row-level security, report sharing and Fabric workspace permissions. A responsibility matrix should clearly separate administration, authoring, editing and viewing.
Do not assume analytical security mirrors D365 security automatically. Explicitly test legal entity, cost centre and population restrictions — including data exported to Excel from Power BI — before the first business user is onboarded.
Data-quality controls and refresh governance
- Revenue reconciliation by period and legal entity after every scheduled refresh.
- Detection of unposted and cancelled documents included in facts (confirm expected exclusion rules).
- Missing or invalid financial dimensions (cost centre, department, project) flagged before reporting.
- Last-refresh timestamp monitored with an alert for missed refresh windows.
- Source-row count and fact-model row count comparison per entity per period.
- KPI-definition change log maintained in the data dictionary.
A discrepancy in a dashboard may originate in the business process, D365 configuration, Dataverse integration, BPA dimensional model, Fabric shortcut or the Power BI report. The support runbook must guide business users and IT to the correct layer efficiently.
Performance and operations
Limit visual count per report page, expensive DAX measures and high-cardinality slicer axes. Separate executive summary pages (fast, aggregated) from detailed investigation pages (slower, filtered). Measure report opening time, slow query log and capacity unit usage.
BPA supports report creation, duplication, editing and sharing; Microsoft reports generally need to be duplicated before customisation. See Create and edit Business performance analytics reports.
Recommended delivery roadmap
- Pilot one finance process (e.g., revenue), two legal entities and five agreed KPIs.
- Formally reconcile with finance controlling — agree and sign off on tolerance thresholds.
- Validate security for every role category and legal-entity combination.
- Validate report performance under the expected concurrent user count.
- Industrialise the data dictionary and first-level support model.
- Extend through Fabric only after standard BPA content is stable and reconciled.
- Roll out gradually with reader and author training and a feedback channel.